Trading Drawdown Explained: Surviving Losing Streaks (2026)
Drawdown is the peak-to-trough drop in your account from its highest point. Here is what the different types mean, the recovery math that makes deep drawdowns so dangerous, why losing streaks are normal even with an edge, and how to survive them when copying signals.
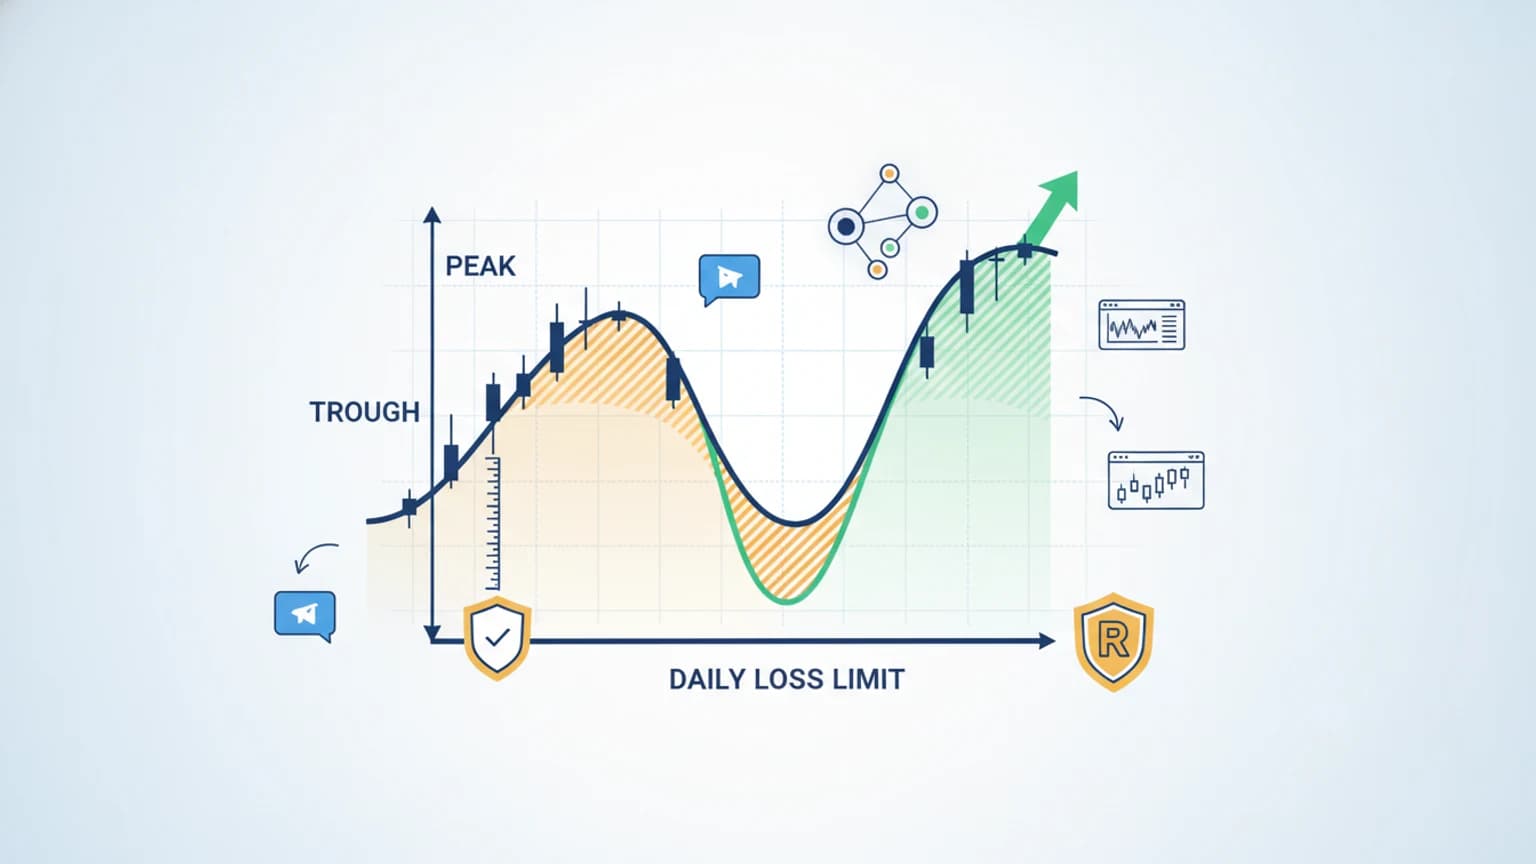
A drawdown is the drop in your account from its highest point to its lowest point before it makes a new high. It is the single best measure of how much pain a strategy puts you through - and the recovery math is brutal: a 50% drawdown needs a 100% gain just to get back to even. That asymmetry, not the size of your winners, is what decides whether an account survives. This guide explains the types of drawdown, why deep ones are so dangerous, why losing streaks are normal even with a real edge, and how to keep drawdowns survivable when you are copying signals.
Most accounts are not destroyed by bad signals. They are destroyed by good signals sized so aggressively that one ordinary losing streak turns a recoverable dip into a hole too deep to climb out of. Understanding drawdown is how you avoid being that account.
What a drawdown actually is
Drawdown is the peak-to-trough decline in equity, measured as a percentage from the high-water mark - the highest value your account has reached. A $10,000 account that falls to $8,500 is in a 15% drawdown; it only ends when a new equity high is made.
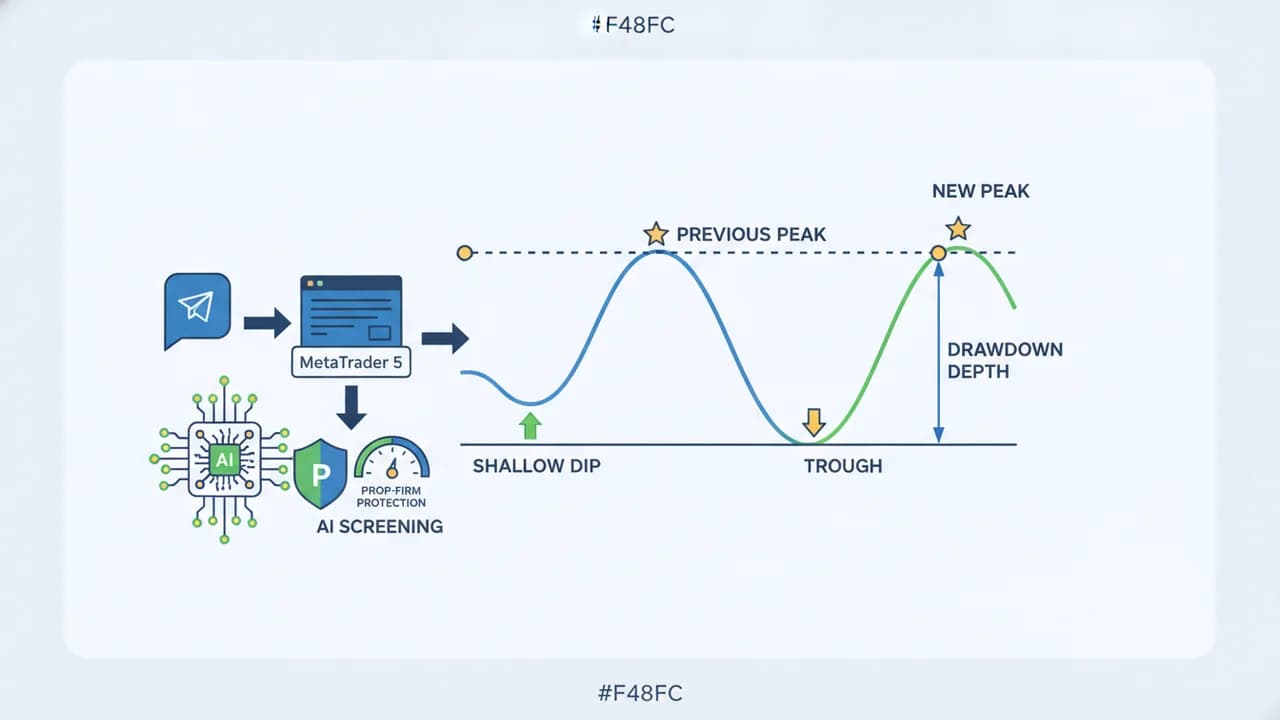
The reason traders obsess over drawdown rather than just total return is that two strategies with the same end result can feel completely different along the way. One grinds steadily upward; the other doubles your money but only after a stomach-churning 40% drawdown you would probably have abandoned in real life. Drawdown captures the worst stretch your account actually lived through - the part that decides whether you stick with a plan or panic out at the bottom.
"The most important rule of trading is to play great defense, not great offense." - Paul Tudor Jones
The types of drawdown
Not all drawdown numbers mean the same thing. Five terms come up constantly:
- Absolute drawdown - the fall from your starting balance to the lowest point below it. It tells you how much of your initial deposit was ever at risk.
- Maximum drawdown - the largest peak-to-trough fall over the whole history. This is the headline risk number for any strategy or track record.
- Relative (or trailing) drawdown - measured from the highest balance reached, so it moves up as your account grows. Many prop firms use a trailing version.
- Closed vs floating drawdown - closed drawdown counts only realised losses; floating drawdown includes open positions sitting in the red. A daily-loss breach can come from floating losses alone, which catches traders who think an unrealised loss "doesn't count yet."
- Daily drawdown - the loss within a single trading day, the basis of the most common prop-firm limit.
Knowing which one a firm or a track record is quoting matters. A channel advertising a "12% max drawdown" on closed trades only may have sat in far deeper floating drawdowns along the way.
The recovery math: why deep drawdowns are dangerous
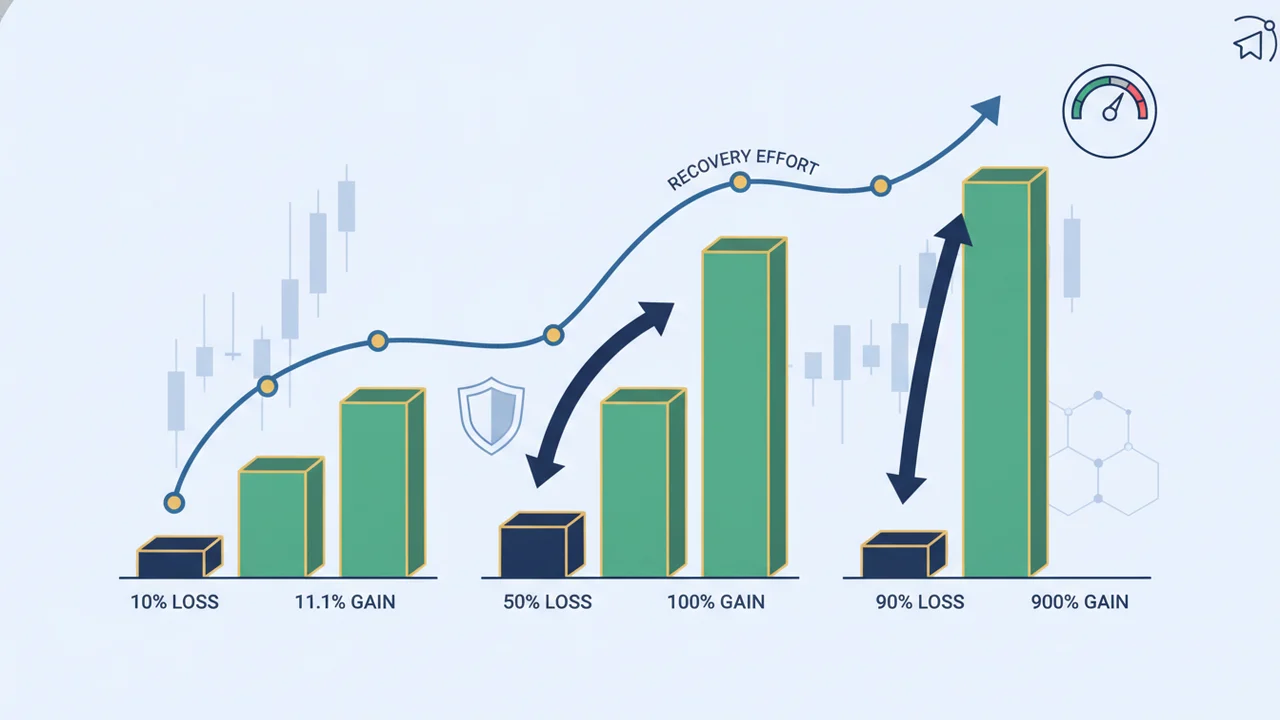
The defining feature of drawdown is that recovery is asymmetric. To get back to even, the percentage gain you need is always larger than the percentage you lost, and the gap widens fast as the hole deepens.
| Drawdown | Gain needed to recover |
|---|---|
| 5% | 5.3% |
| 10% | 11.1% |
| 20% | 25% |
| 30% | 42.9% |
| 50% | 100% |
| 75% | 300% |
| 90% | 900% |
A 10% drawdown is a minor inconvenience - an 11% gain erases it. A 50% drawdown is an emergency, demanding you double the surviving capital just to break even. And a 90% drawdown is effectively terminal: needing a 900% return to recover means the account is, for practical purposes, gone. This single table is the strongest argument in trading for keeping risk small: the cost of a large drawdown is not linear, it is exponential. Protecting against deep drawdowns is worth far more than squeezing out extra upside, which is the entire logic behind disciplined position sizing.
Losing streaks are normal - even with an edge
Traders blow up not because losing streaks are unlikely, but because they size as if streaks will not happen. They will. With a 50% win rate, the chance of any given run of seven trades all losing is about 0.8% - but across a few hundred trades, a seven-loss streak somewhere becomes more likely than not. A real, profitable strategy still serves up long cold spells; that is the texture of probability, not a malfunction.
The practical consequence is simple. If you risk 2% per trade and hit a perfectly normal eight-loss streak, you are down roughly 15% - a serious drawdown from ordinary variance. Risk 5% per trade into the same streak and you are down about 34%, deep in the dangerous zone of the table above. The streak is identical; only the sizing changed the outcome from "annoying" to "account-threatening." As we discuss in can you actually make money copying Telegram signals, surviving the cold streaks is what lets a genuine edge compound over the long run.
What turns a dip into a disaster
Drawdowns are unavoidable; deep drawdowns are usually self-inflicted. Four behaviours do most of the damage:
- Over-sizing. Risking too much per trade so a normal losing streak becomes a catastrophic loss - the single biggest cause.
- Revenge trading. Trying to win back a loss quickly by increasing size, which compounds the drawdown instead of repairing it.
- Correlated positions. Several "different" trades that are really the same bet (long EUR/USD, long GBP/USD, short USD/JPY) all lose together, so a single market move hits the whole book at once.
- No stop-loss. Letting a loser run "until it comes back" converts a small, planned loss into an open-ended floating drawdown - exactly how the worst blow-ups happen.
Each of these is a discipline problem, not a market problem - which is good news, because discipline is something a rules-based risk system can enforce automatically when willpower fails.
What drawdown looks like in real signal channels
The numbers above are arithmetic. Here is what actually happened to the channels our users backtested, measured on 15 September 2026 across the eight channels with at least 10 completed trades. The figure is an R-based backtest drawdown - the deepest peak-to-trough decline of the channel's cumulative result, expressed in units of your own per-trade risk, not in dollars:
| Channel (anonymised) | Completed trades | Expectancy (R/trade) | Backtest max drawdown (R) |
|---|---|---|---|
| Gold intraday | 17 | +0.14 | 1.98 |
| Gold scalper | 14 | +0.35 | 0.94 |
| Multi-asset swing | 12 | +0.52 | 1.64 |
| Gold scalper | 12 | +0.23 | 3.06 |
| Multi-asset intraday | 20 | -0.25 | 6.00 |
| Gold scalper | 18 | -0.24 | 4.48 |
| Gold scalper | 17 | -0.40 | 6.77 |
| Gold scalper | 10 | -0.20 | 2.56 |
Translate the worst row: 6.77R of drawdown at 1% risk per trade is a 6.8% account drawdown - survivable. At 3% risk per trade it is a 20% drawdown, which needs a 25% gain to recover. At 5% it is 34%, and on a funded account with a 10% maximum loss it is an ended evaluation. The channel did not change. Your sizing did.
Note also that the deepest drawdowns belong to the negative-expectancy channels, and the shallowest to the positive ones. That is not a coincidence; it is what a negative edge looks like in motion. You can run the same arithmetic on your own numbers with the expectancy calculator.
Drawdown rules on prop-firm accounts
Pre-Trade Breach Check
Every signal is checked against your firm's limits before it can execute
Nowhere is drawdown more concrete than on a funded account, where it is a hard line rather than a feeling. Most programs set a maximum daily loss (commonly 5%) and a maximum overall drawdown (commonly 10%), and breaching either ends the account instantly - as detailed in the FTMO daily-loss limit and the FTMO rules complete guide. An FPFX Technologies study of more than 300,000 prop accounts found that 14% passed the evaluation and only about 7% of traders ever took a payout - the binding constraint is the loss rules, not the strategy (FPFX Technologies data reported by Finance Magnates).
This is why funded traders size so conservatively. A 5% daily limit gives a 1%-per-trade trader about five losers of room before a breach; drop to 0.5% and you get ten; to 0.25% and you get twenty. Most traders passing a prop-firm challenge deliberately use 0.25%-0.5% per trade precisely so a routine losing streak stays well clear of the daily cap. The math of the recovery table makes the trade-off obvious: the downside of a breach is total, while the upside of bigger size is marginal.
How to survive drawdowns when copying signals
When you copy other people's calls, you control the sizing and the limits even though you do not control the trades. That control is your whole defence:
- Cap per-trade risk at a small, fixed percentage of equity - typically 0.25%-1% - so no single loss or streak is fatal.
- Set a daily-loss limit that halts new trades after a defined drawdown for the day, breaking the revenge-trading loop before it starts.
- Size from your own equity, never the provider's lot size, so your drawdown reflects your plan rather than their account.
- Cap total exposure, not just per-trade risk, so several open positions cannot all hit their stops in one move. Telegram AI Trader enforces this as a maximum share of margin used plus a daily-loss percentage; it does not detect correlation between symbols, so keeping EURUSD and GBPUSD longs from stacking is still your judgement call. The best prop-firm copiers all work this way.
- Keep stops on every trade, accepting small planned losses instead of open-ended floating ones.
A copier applies all five on every trade without discretion or fatigue. Telegram AI Trader sizes each position from your equity, enforces a per-trade risk cap and a daily-loss limit, and on funded accounts tracks your daily and overall drawdown against the limits you store, warning you at 75% of your buffered allowance, blocking new trades and - if you enable it - flattening open ones. It cannot prevent a losing streak, and it cannot promise the streak stays shallow: a gap or a violent slip can carry equity past any buffer. What it does is remove the human reaction time that turns a bad day into a breached account.
The bottom line
Drawdown is the truest measure of trading risk because it captures the worst the account endured, and its recovery math is unforgiving - a 50% fall demands a 100% gain to undo. Losing streaks are a normal feature of even profitable strategies, so the job is not to avoid them but to size and limit them so they stay shallow. Cap your per-trade risk, set a daily-loss stop, size from your own equity, and never run a position without a stop. Do that and drawdowns stay in the survivable zone where a real edge can compound; ignore it and one ordinary cold streak can dig a hole no winning run will fill.
See Telegram AI Trader pricing or start a free trial to copy Telegram signals to MT5 with per-trade risk caps and a daily-loss guard that keeps drawdowns survivable.
Frequently Asked Questions
What is drawdown in trading?
Drawdown is the decline in your account equity from its highest point (the peak, or high-water mark) to its lowest point (the trough) before a new high is made. It is usually expressed as a percentage. If a $10,000 account falls to $8,500, that is a 15% drawdown. It measures how much pain a strategy puts you through, not just its final return, which is why it is one of the most important risk metrics in trading.
What is the difference between drawdown and loss?
A loss is the result of a single trade or a closed position. Drawdown is the cumulative peak-to-trough fall across many trades, including open floating losses. You can have several losing trades and still be in a small drawdown if winners cushion them, or a large drawdown from one ungoverned position. Drawdown is the better measure of risk because it captures the worst stretch your account actually lived through.
Why is recovering from a drawdown so hard?
Because recovery is asymmetric: the percentage gain needed to recover is always larger than the percentage lost. A 10% drawdown needs about an 11% gain to break even, a 25% drawdown needs 33%, and a 50% drawdown needs a 100% gain just to get back to even. The deeper the hole, the more disproportionately hard it is to climb out, which is why avoiding large drawdowns matters more than chasing large gains.
Are losing streaks normal in trading?
Yes. Even a genuinely profitable strategy with a 50% win rate will produce runs of six, seven, or more consecutive losses given enough trades - it is basic probability, not a broken system. The mistake is sizing as if streaks will not happen. Disciplined traders assume the streak is coming and size each trade so that a realistic run of losers is survivable rather than fatal.
What drawdown limit do prop firms use?
Most funded-account programs set two limits: a maximum daily loss (commonly 5%) and a maximum overall drawdown (commonly 10%), with some using a trailing drawdown that follows your highest balance. Breaching either ends the account. Because the limits are hard lines, funded traders typically risk only 0.25% to 0.5% per trade to keep a normal losing streak well clear of the daily cap.
Ready to Automate Your Trading?
Join traders who never miss a signal. Start with a free trial and see the difference AI-powered automation makes.
Continue Reading
Best MT5 Copy Trading Software (2026)
A 2026 comparison of the best MT5 copy trading software - account-to-account copiers and Telegram signal copiers - ranked on speed, risk controls, and price.
Read moreTrading StrategiesCan You Actually Make Money Copying Telegram Signals? (2026)
Can you make money copying Telegram signals? An honest 2026 breakdown of the math, the risks, why most traders lose, and how to actually tilt the odds.
Read moreTutorialHow to Copy Telegram Signals to MT4 (Not Just MT5) in 2026
How to copy Telegram signals to MT4 automatically in 2026: the setup steps, the copiers that support MT4, and when to switch to MT5.
Read more